Graphical history view
Visual representation of how a single data row flows through triggers and actions, with color coding showing execution status and errors.
The graphical history view shows the processing of a single data row emitted by the trigger(s):
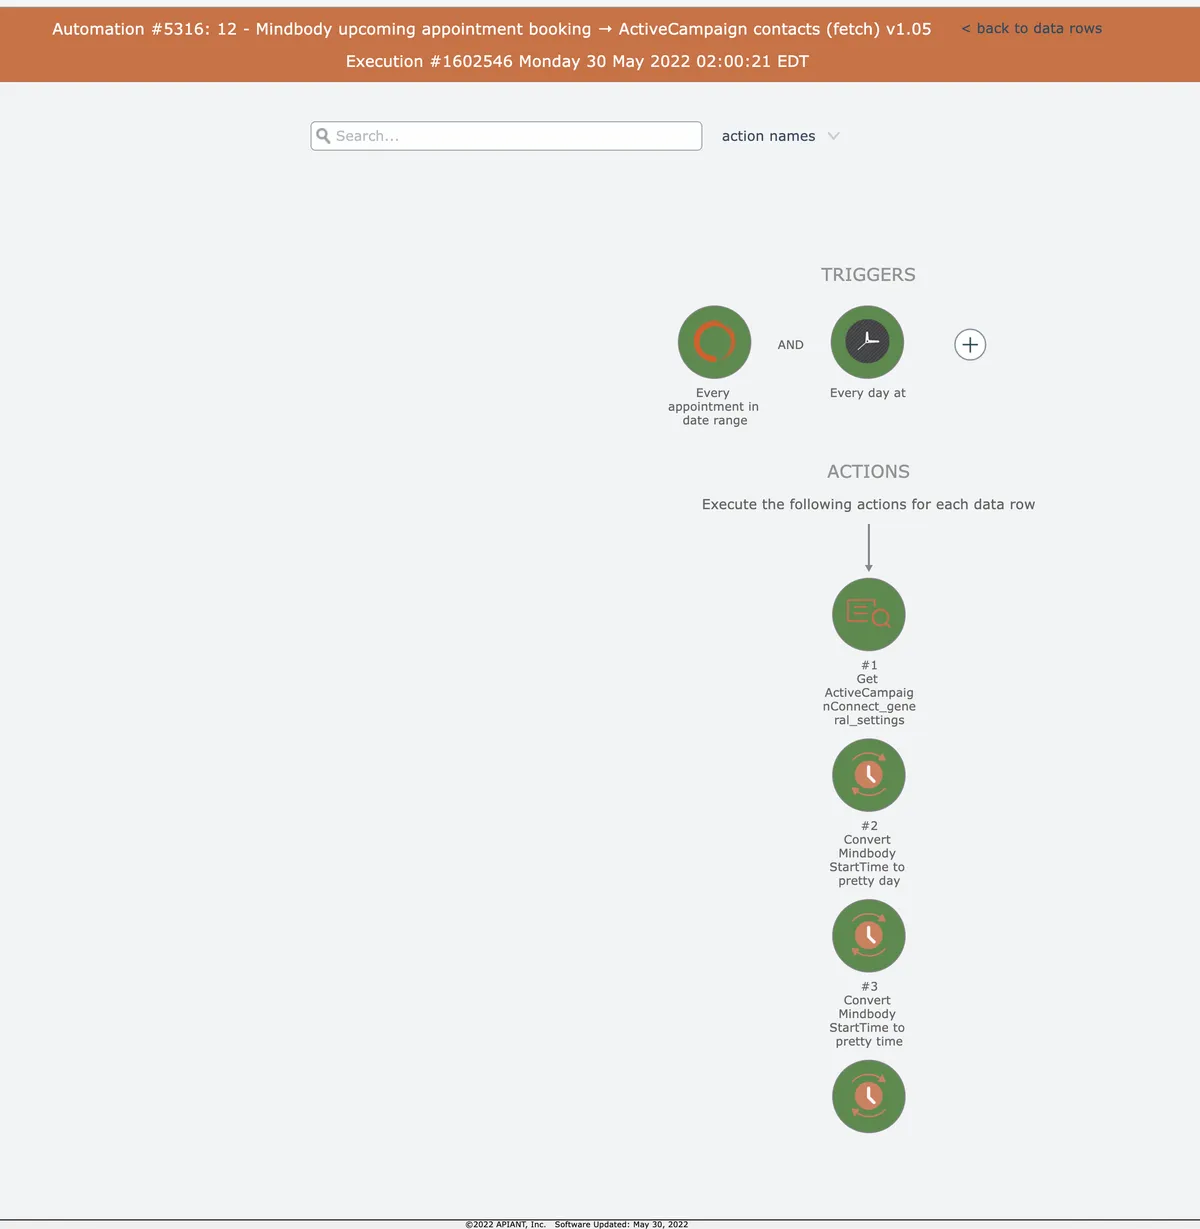
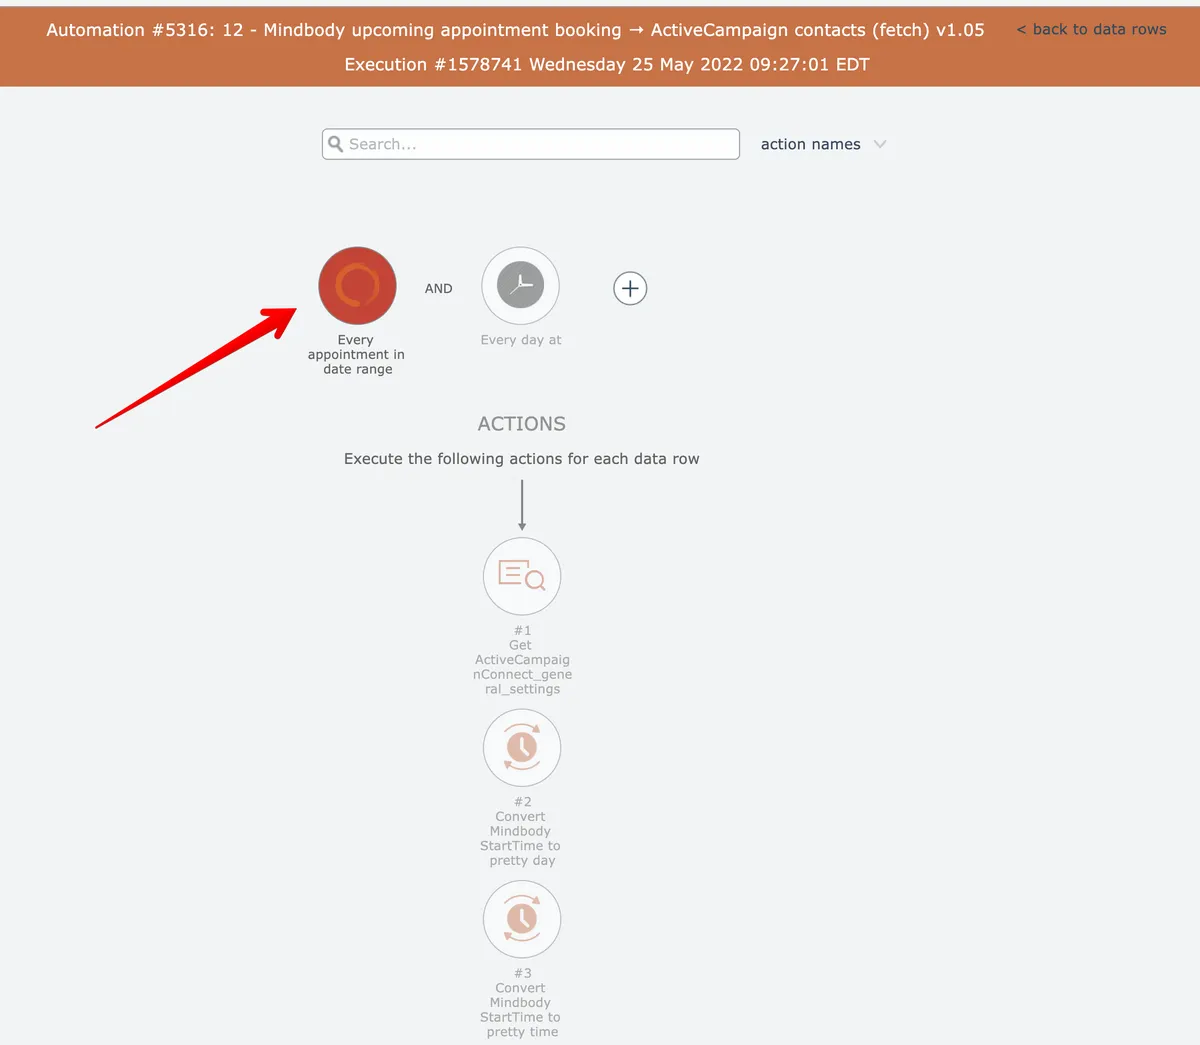
Successfully processed triggers and actions are highlighted in green. Triggers and action not executed are grayed out. Any triggers or actions reporting errors are highlighted in red:
In this section
Obtaining a step number in graphical history
Right-click any action in graphical history to copy its step number to your clipboard for reference or debugging.
Searching for actions in graphical history
Filter and navigate workflow actions in graphical history view by searching output data, names, settings, field mappings, or step numbers with highlighted results.
Viewing input/output
Easily track and monitor triggers and actions in real-time with graphical history. Hover over each one to view detailed input and output information. Enhance your user experience and optimize your workflows effortlessly.
Viewing item details in history
View configuration settings and debug logs for triggers, actions, conditionals, and loops directly from the graphical history view by clicking items or using the Details button.